Features With new technologies, come new capabilites
Get a new perspective
Google Maps is great and all, but the images tend to be at least a couple of years old and lack the resolution for doing real work. Make your own maps and get a new perspective on things with accurate, high resolution imagery you control.

3D model-based stitching
We use the most cutting-edge methods available for creating our maps. Combining multiple looks at an area as an aircraft flies over allows us to create a 3D model from which can derive stunningly accurate orthophoto maps. The textured 3D model can be downloaded and previewed online. (Sample)

Georeferencing (optional)
Georeferencing is what aligns your images to known points on the ground. It is not required, but with a few clicks you can accurately reference your map and use it as an overlay in many GIS systems or Google Earth. Maps Made Easy is the Internet's only online georeferencing interface.

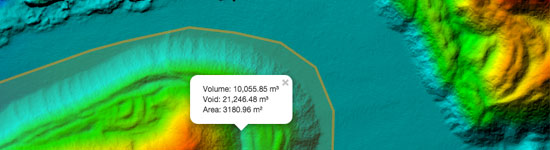
Stockpile Volume Measurement
Our web-based volume measurements make measuring and tracking stockpile volumes quick and easy. There is no expensive software to buy and the measurements can be made directly from your web-browser. Volumetric measurements are easily shared with others and are stored to track progress over time.
Map Pilot App for iOS and Android
We offer the best-in-class iOS and Android apps that helps ensure your flight planning is correct. Define the survey area, select you level of detail, and fly. The app will take care of the rest. Easily plan surveys of large areas that require multiple batteries.

Share with links
Provide others with links to take them directly to maps that you designate as being public. If you see something in one of your maps that you think someone would be interested in, just email them the link.

Normalized Difference Vegetation Index (NDVI) Processing
The normalized difference vegetation index (NDVI) is a simple graphical indicator that can be used to analyze remote sensing measurements and assess whether the target being observed contains healthy vegetation or not. Maps Made Easy is the Internet's easiest way to stitch, catalog and annotate NDVI maps.

Built for professionals
Maps Made Easy was designed with high-end users in mind. It is not complicated or hard to use, but in the outputs will enable various industries to document, measure, track and visualize their assets in a whole new way. Time is money. Maps Made Easy saves time.

Share with iFrame embed codes
Any map you create on the site can easily be embedded in your own website or blog. The service of the imagery is backed by our reliable servers and gives you control over when a map is publicly viewable and when it isn't.

Fully online processing
Map processing is complicated. It takes a lot of computing horsepower and processor time. If you were to attempt to do the same processing we are doing on our purpose built server, you would likely not have the system resources or not be able to use your computer for hours on end. Let us do the heavy lifting so you can get back to work.

Multi-visit management
Multiple georeferenced visits to the same mapping site can be combined and arranged with our drag-and-drop interface. You can build and quickly view a history for every point on the map. This feature is especially useful for construction monitoring, agriculture, pipeline documentation and solar array inspection.

